Detailed Report


The idea of using algorithms and creativity together is always highly debated. On one hand, creativity is normally seen as an inherently human trait, one that comes from “within” the human mind and soul. On the other hand, certain genres are known to approach music very systematically, almost formula-like in their strategy to make a hit. Two prime examples of this are Pop and Country, where it's theorized that major labels sit down and formulate songs from chords to lyrics, in order to guarantee a money maker. With these two camps of thought, we have a tale of two questions; first, is it true that the most popular songs of a given genre follow some sort of pattern, and second, are these patterns significant enough to build a model to predict the success of new songs, and whether these models have some consistencies access genres.
Investigation


We first approached this problem by loading our data into a pandas dataframe, and doing a few plots to see where how our data was distributed across features. Upon doing this, we can narrow down our set of attributes to ones that seem to give us a good picture of where each example lies. The columns we decided to use were: 'artist.hotttnesss', 'bars_start', 'beats_start', 'duration', 'familiarity', 'key', 'loudness', 'mode','song.hotttnesss', 'tatums_start', 'tempo', 'time_signature', 'year'. This, along with dropping any data that was equal to NaN gave us a dataset that had 13 columns and ~8,000 rows.

For this project, we used the scikit python library to handle our classifier training. We first started with a DecisionTreeRegressor, because our output label was a continuous variable. After splitting our data into training and testing sets, we were able to calculate a (pretty terrible) score for our classifier and found a mean absolute error of 0.18 after our first attempt.

Experiments and Improvements


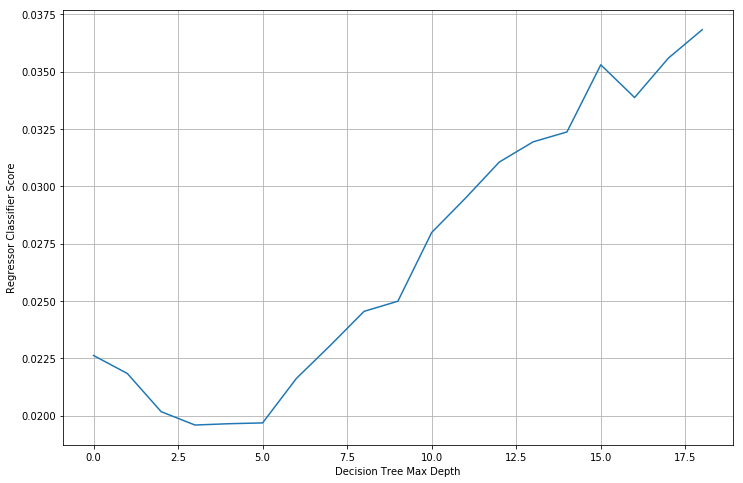
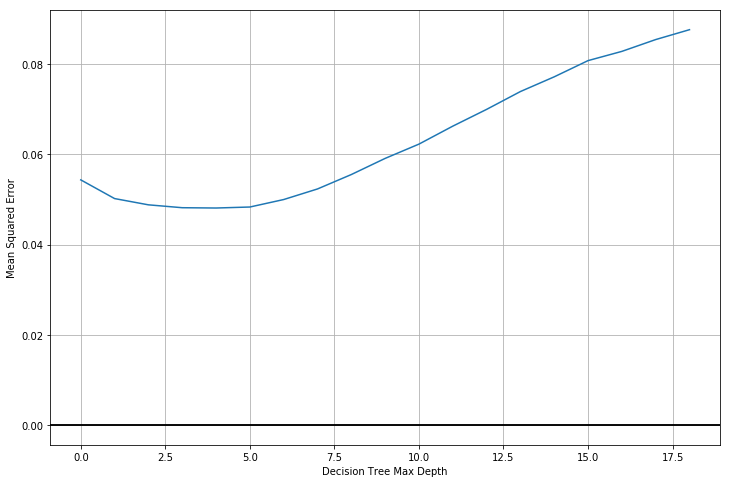
To check how our improvements are doing, we first wrote a script to perform N fold cross-validation for varying model parameters. This function will allow us to tweak our models and report which setting work best for this dataset. When varying the max_depth of our DecisionTreeRegressor, we found the following trend:

For this case, using a decision tree depth of more than 5 leads to overfitting of our data.

While this model is still pretty poor, there are still improvements we can make to improve its accuracy. The next technique that we can try is preprocessing our input data to make better sense of it in our model.

Preprocessing Data


A lot of our initial error came from the fact that our data wasn’t as clean as it could have been. The MSD isn’t complete, and if a field is missing then it’s replaced with either “NaN” or 0.00000. While this make the data somewhat complete, it messes with our classifier and adds noise to the data. To account for this, we only base our model off features we observe, and therefore only train our model with data that has a finite value for it’s “hotness” value. By doing this, we cut the size of our dataset from ~8,000 rows to ~4,000, but we can be sure these ~4,000 have defined values for the attribute we’re trying to predict.

Adding this improvement increased our classifier score by .1, and reduces our MSE to less than 0.02.

Binary Classification


While the Decision Tree regressor worked pretty well, upon further analysis, we realized that you don’t necessarily need to calculate what a songs “hotness” would be, but instead would be more interested in whether a song would be over a certain “hotness” threshold. In this case, we don’t need a regressor, but instead can use a regular decision tree classifier, just as long as we add an additional column to our dataset. This column is named “hot?” and is derived from the boolean expression:

Hot? = (row.hotness > mean_hotness)

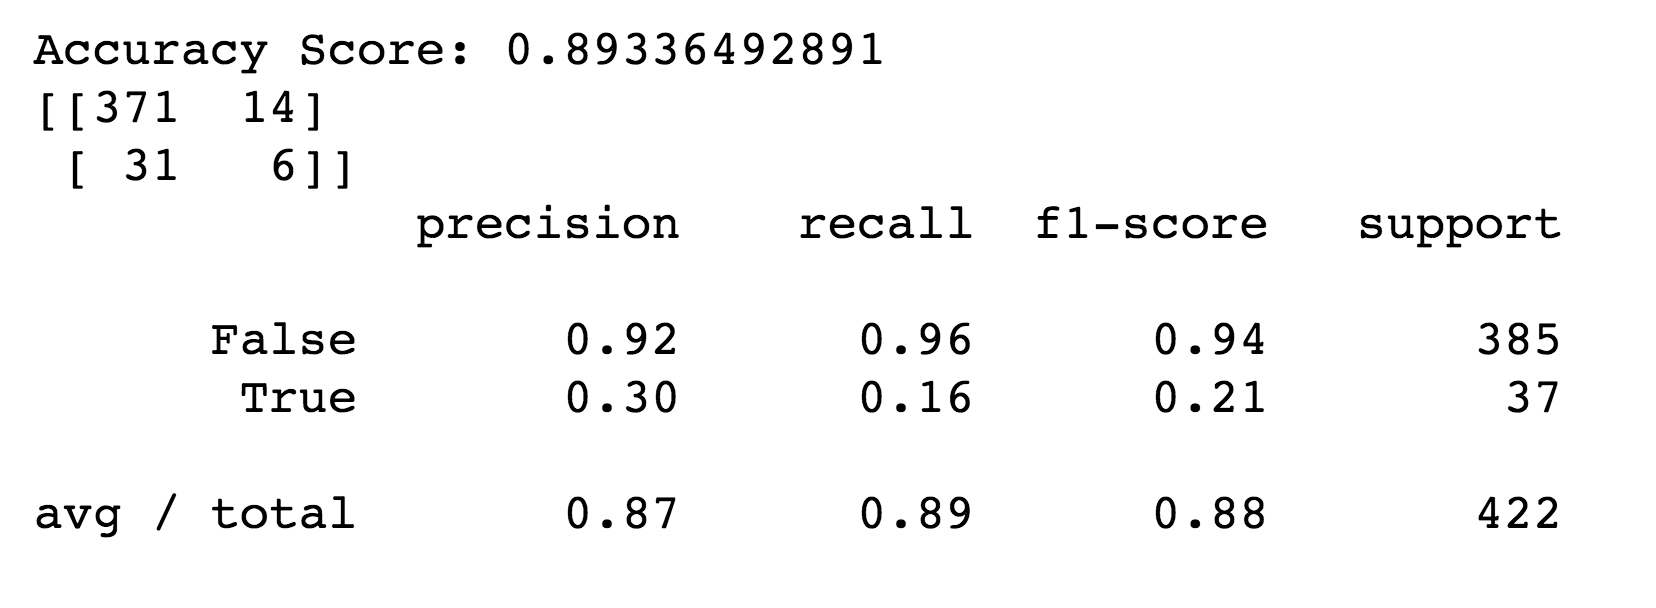
Using this formula, we now have a binary output to predict as opposed to using regression to calculate an output number. When doing this, we get a pretty good classifier, with our model being able to predict whether a song is above the mean hotness with an accuracy score of 89%.

Read Jupyter Notebook

Future Work


An obvious improvement that can be made with this analysis is using more data. The original MSD is approximately 280gbs, which is way to much to process on a single machine. Using a cloud computing instance with a tool such as Hadoop can allow you to build a better model based off more data.

Another improvement that can be made is clustering around music genre, to see if certain groupings appear across genres. The things that make a pop song popular might not make a hip hop song popular, so it'd be interesting to see how the feature distributions change across genres.